generating great circle graphs
I started writing a C++ program to generate “great circle graphs” for a class in which we explored the 3-colorability of such graphs. It’s not complete, but I wanted to post what I have anyway as I found certain aspects of this quite interesting.
The output of the C++ progam is a JSON description of great circles and their points of intersections on a sphere. The JSON can then be used in a d3.js globe. The code is on my GitHub page.
use mouse to drag globe
credit to ivycode for draggable d3 globe
the great circle graph
A single great circle is not a graph, but imagine that we draw two great circles on a sphere. At 2 points, the two circles intersect. Let’s create vertices at these 2 points of intersection.
Now we have a graph (a set of vertices connected by edges, where segments of the intersecting great circles become edges).
If we were to draw any number of great circles on a sphere, and then create vertices at any points of intersection, but avoid adding circles that would yield a point of intersection with more than 2 circles, then we’ve got a “great circle graph.”
how it works
- I start by generating a pair of random points on a sphere. Since there is only one great circle that passes through two points on a sphere, I can call these 2 points a new “great circle.”
- I add this circle to a list of circles.
- Loop for number of circles (passed as parameter):
- I generate 2 new random points to represent a new circle.
- I check to make sure that this new circle doesn’t result in more than 2 circles passing through one point
- I calculate the intersections of the new circle with existing circles and adjust edges and vertices in the graph
- I add this circle, and the new vertices to the list of circles and the list of vertices
- I then output the list of circles and the list of vertices in JSON
The last step is to then take the output of the C++ program and feed it to the JavaScript globe.
I have yet to come up with a good way to figure out the coloring of the output. This is actually a computationally difficult (NP complete) problem, so I have a lot of work to do here…
calculating points of intersection of great circles
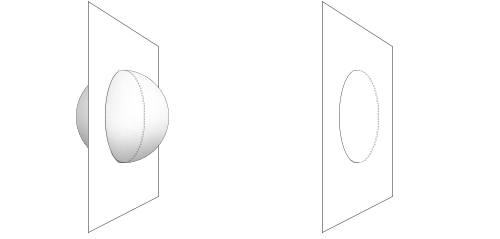
A great circle on a sphere is basically a circle on a plane. The plane passes through the “center” of a sphere, where the cross-section of the sphere has the greatest radius possible.

Imagine that the sphere is centered at the origin. Then our plane passes through the origin, and the circle is centered around the origin.
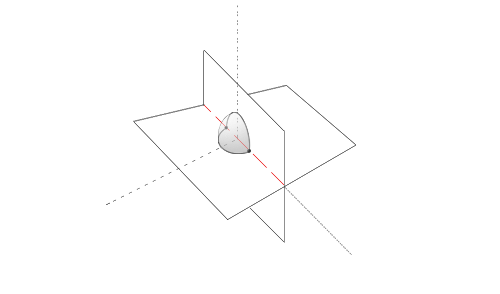
Now imagine two such planes and circles that pass through the origin at different angles.

We know that any two planes that are not parallel will intersect along a line. In this case, since we are positioning our planes such that our “great circles” are centered at the origin, our line of intersection passes through the origin.
On the graph above, the red line is the line of intersection shared by our two planes. Notice that the red line passes through the points of intersection of our two circles.
As you can clearly see in the picture, we can find the 2 points of intersection of our great circles by finding the line of intersection of the two planes upon which each circle lies.
normal vectors and dot products
Planes have a nice property called the normal vector that makes calculating this line a breeze when we use the dot product of the two plane’s normal vectors.
I won’t get into detail on how to do this. There are many detailed walkthroughs on other sites on how to find the line where two planes meet.
The important takeaway from this post is to understand how we got two planes from two great circles, and why.
use of unit vectors
To make all of my calculations easier through out my code, I assume that the radius of our sphere is 1 unit. This means that each point of intersection of two great circles can be found by following the line of intersection 1 unit out from the origin.
When we put all of this together, finding the two points of great circle intersections is simple:
vector<shared_ptr<Point> >
GreatCircle::twoCircleIntersections(GreatCircle *c2) {
  // use the line intersection of the circle's planes

  vector<float> v = plane->intersectionVector(c2->plane);
  v = unitVector(v);
  // use the unit vector that is the intersection vector to generate 1 point

  shared_ptr<Point> i1 = make_shared<Point>(v[0], v[1], v[2]);
  // rotate to opposite side of the circle for other point

  shared_ptr<Point> i2 = make_shared<Point>(
    i1->theta + PI, 2 * PI - (i1->phi + PI));
  return vector<shared_ptr<Point> > {i1, i2};
}
motivation for this project
It has yet to be proven that without loss of generality, any great circle graph constructed with these guidelines can be 3-colored. However, it has also yet to be disproven. Nobody has come up with an example of a great circle graph that needs 4 colors for a proper coloring, but nobody has published a proof that concretely explains why a great circle graph can always be 3-colored in any peer reviewed literature.
There is a paper floating around that claims to prove this. However, this has not been published in any peer-reviewed literature. I’m not sure if this proof holds water. I have not gotten too far in disecting it myself, but my professor said it was flawed. If I get a chance to review it myself I might add more detail here about any flaws in the proof.
If this generator could create a graph that requires 4 colors to be properly colored, then I’ve proven that there exists a great circle graph that requires 4 colors.
This would be the easy way out prooving that not all great circle graphs can be three-colored, but most evidence does in fact point to the contrary.
 trevor simonton